
Monitoring Autonomous Agents in Production: Telemetry and Execution Logging
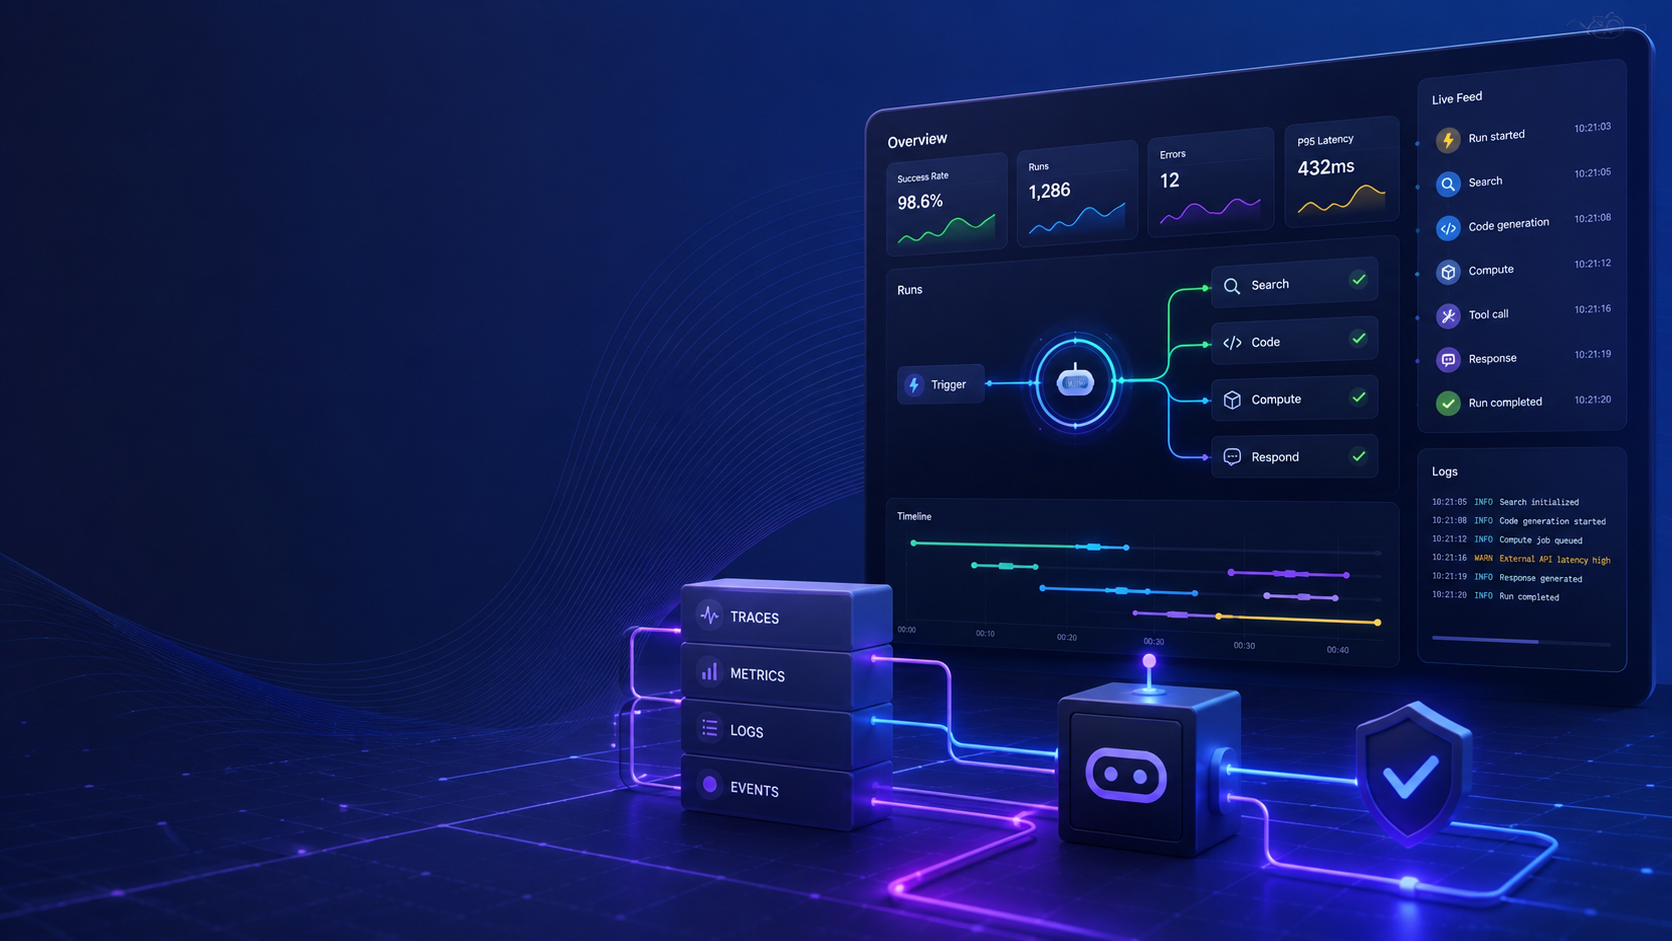
Running autonomous agents locally on a single machine is vastly different from deploying them in a production environment. As agents become more independent, making unsupervised decisions across diverse APIs and databases, visibility becomes paramount. Without comprehensive telemetry and execution logging, debugging a rogue or failing agent is like finding a needle in a haystack blindfolded.
While open-source frameworks provide the foundation for agent behavior, tracking these behaviors safely and systematically requires dedicated infrastructure. ClawLite streamlines this process by offering a pre-configured, real-time observability layer designed specifically for AI agent telemetry, bridging the gap between local prototypes and production-grade deployments.
1. Quick Definitions
Telemetry: The automated collection and transmission of data from remote agents, capturing metrics like API latency, token usage, and error rates. Execution Logging: A detailed, step-by-step chronological record of the actions an agent took, including its reasoning steps and tool calls. Observability (O11y): The ability to understand the internal state of a system (the agent's reasoning and execution pipeline) based on the data it produces. ClawLite: The commercial product layer for autonomous agents that provides out-of-the-box telemetry, centralized logging, and proactive failure alerting without complex setups.
2. Why Production Agents Need Telemetry
When an agent fails, it doesn't just crash like a traditional web server. It might get stuck in an infinite tool-calling loop, burn through expensive LLM tokens, or silently fail to process user inputs correctly.
Key Metrics to Track
- Token Consumption per Task: Identify cost anomalies immediately.
- Tool Execution Latency: Track which external APIs are slowing down the agent.
- Reasoning Steps (Chain of Thought): Store the exact prompts and model responses for auditing.
- Success/Failure Rates: Monitor overall task completion percentages.
3. Implementing Basic Logging in Open-Source
If you are managing your own bare-metal deployment, you will need to implement a logging handler. In Python, this typically means wrapping your agent's execution loop with a centralized logger and exporting logs to an external aggregator like Elasticsearch or Datadog.
```python import logging import json import time
logging.basicConfig( filename='agent_execution.log', level=logging.INFO, format='%(asctime)s - %(name)s - %(levelname)s - %(message)s' )
def execute_agent_step(agent, task): start_time = time.time() try: logging.info(f"Starting task: {task.id}")
result = agent.run(task)
latency = time.time() - start_time logging.info(json.dumps({ "event": "task_completed", "task_id": task.id, "tokens_used": result.token_count, "latency_ms": int(latency * 1000) }))
return result except Exception as e: logging.error(f"Agent failed task {task.id}: {str(e)}", exc_info=True) raise ```
4. The ClawLite Observability Advantage
Building, securing, and maintaining an ELK stack or Datadog integration for agent logging requires significant engineering effort. For teams focused on deploying agents rather than managing logging infrastructure, ClawLite provides an immediate operational advantage.
ClawLite intercepts core framework events natively, translating raw LLM outputs and tool calls into actionable, visual dashboards.
Visual Comparison: DIY Logging vs. ClawLite Observability
| Feature | DIY Agent Logging | ClawLite Dashboard |
|---|---|---|
| Setup Time | Days (configuring ELK/Datadog) | Instant (Zero-Config) |
| Token Tracking | Requires manual calculation logic | Built-in per-session & per-model |
| Execution Replay | Search through raw JSON logs | Visual timeline of agent reasoning |
| Alerting | Custom alerting rules required | Automated alerts for tool failures |
| Cost | Infrastructure + maintenance | Included in the managed workspace |
By offloading telemetry to ClawLite, developers immediately gain the insights needed to optimize their prompts and tools, rather than spending cycles debugging log parsers.
5. Summary Q&A
Q: Can I use standard application monitoring tools (like Prometheus) for AI agents? A: You can, but standard tools are designed for deterministic web requests, not non-deterministic LLM generations. AI agents require specialized telemetry that tracks reasoning loops, token budgets, and tool use, which standard tools struggle to contextualize.
Q: How does ClawLite handle sensitive data in logs? A: ClawLite includes automatic data masking and secure retention policies, ensuring that sensitive user data passed to the agent is not stored persistently in plain text within execution logs.
Q: Does telemetry slow down the agent's response time? A: In a naive implementation, synchronous logging can block execution. ClawLite utilizes asynchronous background events, ensuring that telemetry collection has zero impact on the agent's operational speed.
Q: What is the most critical metric to monitor for early agent failure detection? A: Tool execution failure rate. If an external API changes or rate-limits the agent, the agent will begin failing or hallucinating workarounds. Monitoring tool integration health is essential for stability.